Sunday 1 November 2020

How remove duplicate rows in a large table

-- Create temporary table

CREATE TABLE temp_table LIKE table1;


-- Add constraint

ALTER TABLE temp_table ADD UNIQUE(category);


-- Copy data

INSERT IGNORE INTO temp_table SELECT * FROM table1;


-- Rename and drop

RENAME TABLE table1 TO old_table1, temp_table TO table1;

DROP TABLE old_table1; 

Wednesday 27 May 2020

How to format disk larger than 2TB in Linux

Traditionally I used to use fdisk to do so (here), but it is limited to 2TB disks.

These tips are from techmint with some modification.
apt-get install parted 

1. Check Parted Version

Run the following command, you see message similar to the one shown on the image below. Don’t worry if your parted version is different. Unless specified otherwise, parted will use your primary drive, which in most cases will be /dev/sda.
$ parted
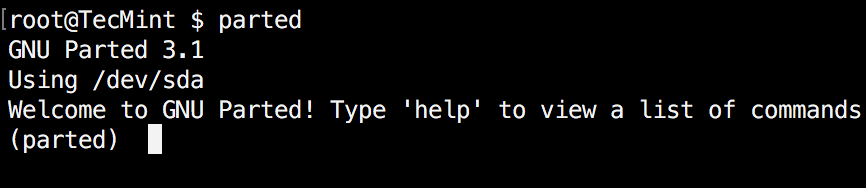
Check Parted Command Version
If you want to exit parted, simply type:
$ quit

2. List Linux Disk Partitions

Now that parted is started, let’s list the partitions of the selected hard disk. As mentioned earlier, parted chooses your first drive by default. To see the disk partitions run print.
(parted) print
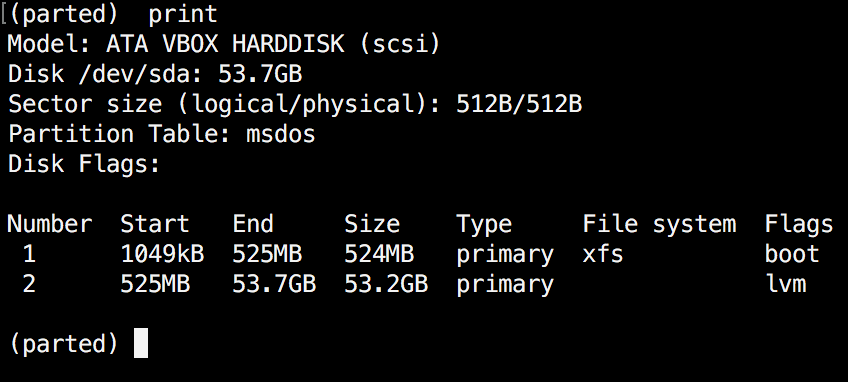
Check Linux Partitions
When running print, it will also display the hard disk information and model. Here is example from a real hard disk (not virtual as shown on the image above) :
(parted) print

Model: ATA TOSHIBA MQ01ACF0 (scsi)
Disk /dev/sda: 320GB
Sector size (logical/physical): 512B/4096B
Partition Table: msdos

Number  Start   End    Size   Type      File system  Flags

 1      1049kB  256MB  255MB  primary   ext2         boot
 2      257MB   320GB  320GB  extended
 5      257MB   320GB  320GB  logical                lvm
In the example above, you can see the disk model, capacity sector size and partition table.

3. List or Switch to Different Disk

If you have more than one hard disk, you can easily switch between disks, by using the “select” command. In the example below, I will switch from /dev/sda to /dev/sdb which is a secondary drive on my system.
To easily switch between disks you can use:
(parted) select /dev/sdX
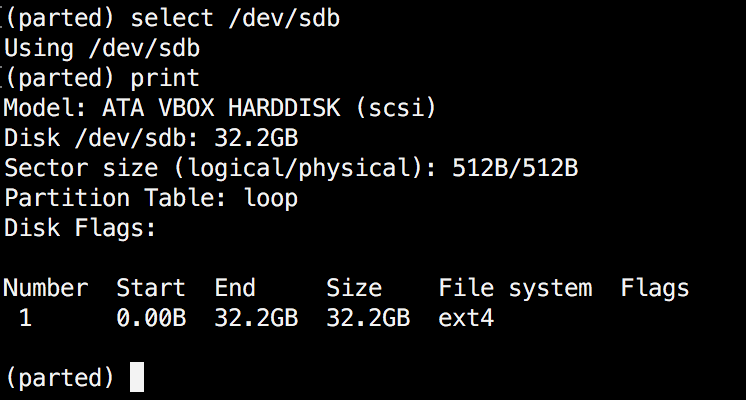
Select Different Disk
Change "X" with the letter of the disk to which you wish to switch.

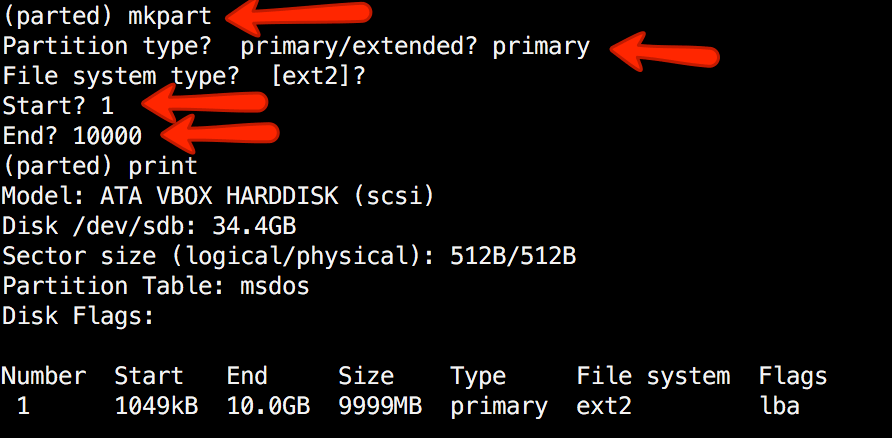
4. Create Primary or Logical Partition in Linux

Parted can be used to create primary and logical disk partitions. In this example, I will show you how to create primary partition, but the steps are the same for logical partitions.
To create new partition, parted uses “mkpart“. You can give it additional parameters like "primary" or "logical" depending on the partition type that you wish to create.
Before you start creating partitions, it’s important to make sure that you are using (you have selected) the right disk.
Start by using print:
(parted) print
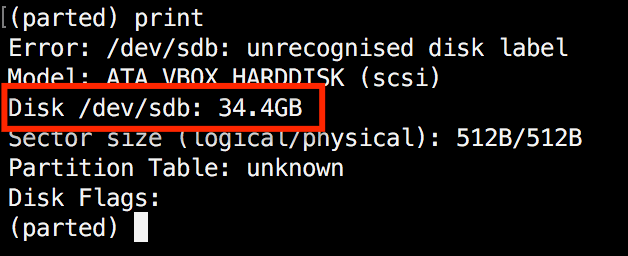
Show Current Linux Disk
As shown on the above image, we are using a virtual drive of 34 GB. First we will give the new disk a label and then create a partition and set a file system on it.
Now the first step is to give the new disk a label name with:
(parted) mklabel gpt  #Note: msdos is not suitble for > 2TBs
Now create the new partition with  mkpart. The listed units are in megabytes (MB). We will create a 10 GB partition starting from 1 to 10000:
(parted) mkpart 0% 100% primary 

Create Primary or Logical Linux Partitions
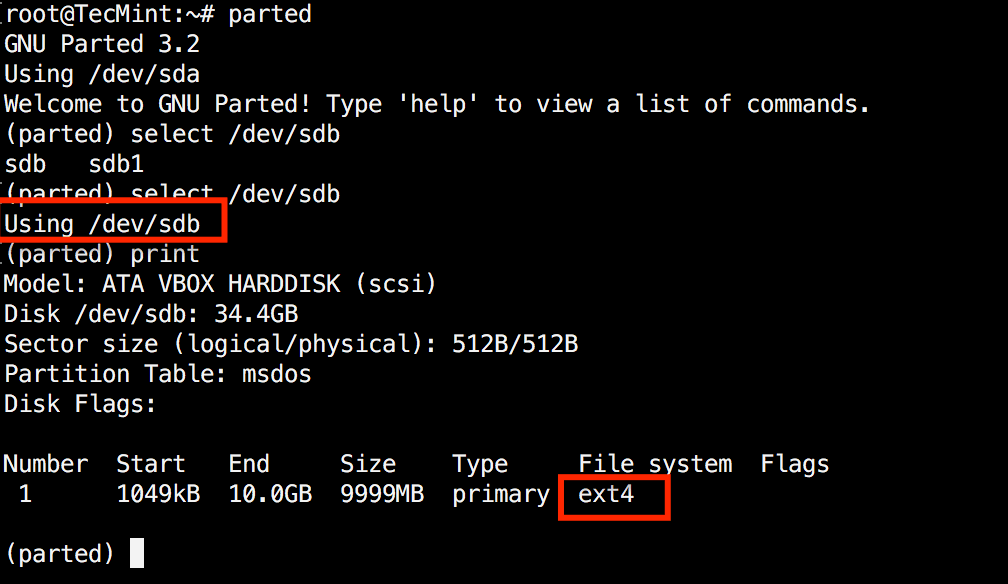
Next,  exit parted with "quit" command. We will format our new partition in ext4 file system using mkfs. To make this happen run the following command:
# mkfs.ext4 /dev/sdb1
Note: It’s important to select the right disk and partition when executing the above command!
Now let’s verify our results, by printing the partition table on our secondary disk. Under file system column, you should see ext4 or the file system type that you have decided to use for your partition:
Verify Disk Partition Filesystem

5. Resize Linux Disk Partition

Parted includes multiple useful functions and one of them is "resizepart". As you have probably figured this out by now, "resizepart" helps you resize a partition.
In the example below, you will see how to resize an existing partition. For the purpose of this example, we will be using the earlier created partition.
First you will need to know the number of the partition that you will be resizing. This can be easily found by using "print":
(parted) print
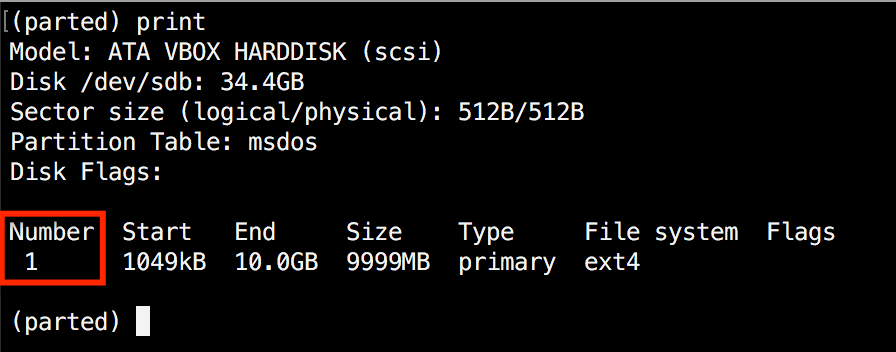
Find Linux Partition Number
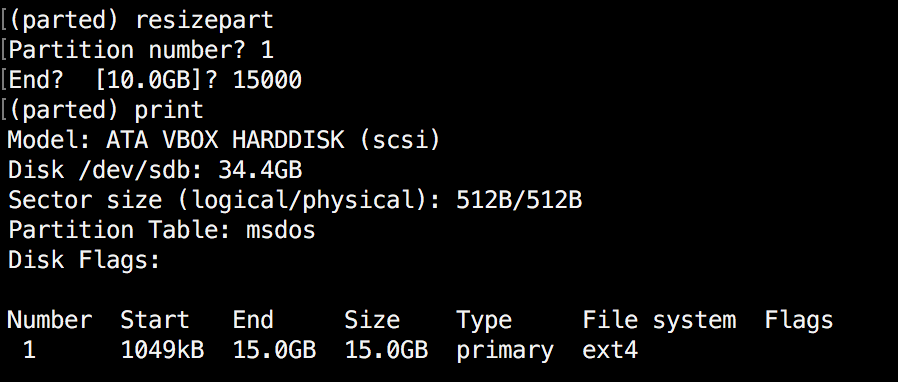
In our example, the partition number is "1". Now run the resizepart command:
(parted) resizepart
You will be asked for the number of the partition that you will resize. Enter it’s number. After that, you will be asked to set the new ending point for this partition. Remember that by default the units are in MB. In our example, we have set the new partition size to 15 GB:
(parted) resizepart 
Partition number? 1
End?  [10.0GB]? 15000
Now verify the results with "print":
(parted) print
Verify Linux Resize Partition

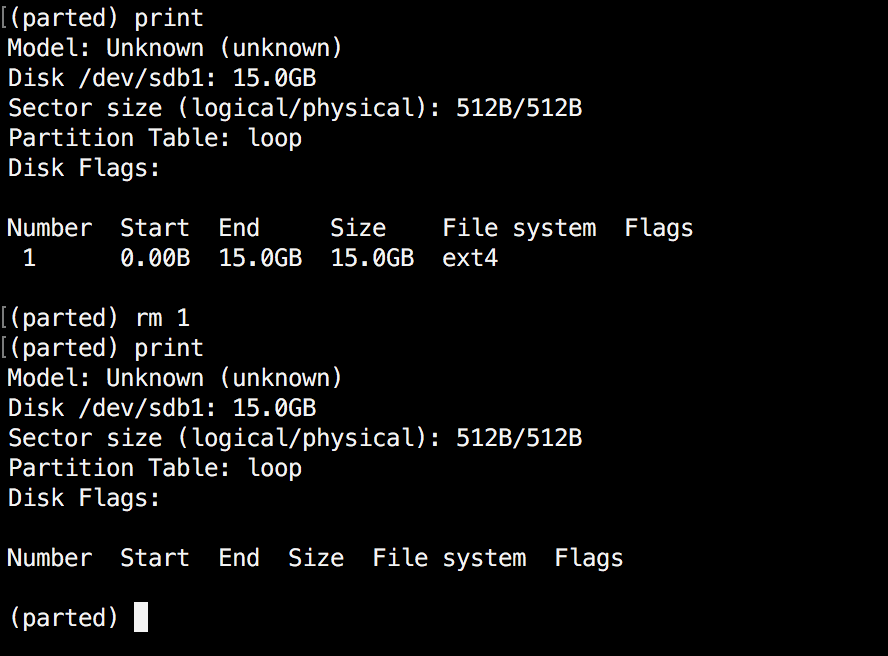
6. Delete Linux Partition

The next thing you will learn is how to delete a partition from your hard drive. To do this, you will need to use the "rm" command within parted. To delete a disk partition you will need to know it’s number.
As mentioned earlier, you can easily obtain this number by using "print". In our example, we will delete the partition with number 1 from our secondary drive /dev/sdb1:
(parted) rm 1
Verify the results by printing the partitions table:
Delete a Linux Partition

7. Rescue Linux Disk Partition

Parted supports a “rescue" utility that helps you recover a lost partition between a starting and ending point. If a partition is found within that range, it will attempt to restore it.
Here is an example:
(parted) rescue
Start? 1
End? 15000
(parted) print
Model: Unknown (unknown)
Disk /dev/sdb1: 15.0GB
Sector size (logical/physical): 512B/512B
Partition Table: loop
Disk Flags:

Number Start End Size File system Flags
1 0.00B 15.0GB 15.0GB ext4

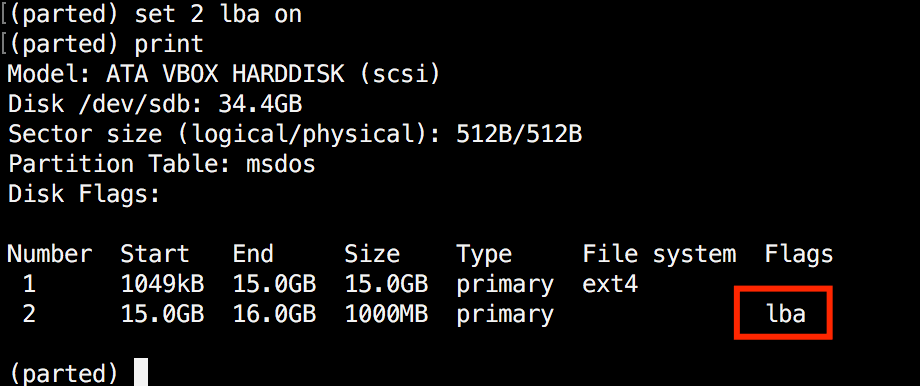
8 Change Linux Partition Flag

Using parted, you can change the state of a flag for disk partitions. The supported flags are:
  1. boot
  2. root
  3. swap
  4. hidden
  5. raid
  6. lvm
  7. lba
  8. legacy_boot
  9. irst
  10. esp
  11. palo
The states can be either "on" or "off". To change a flag simply run "set" command within parted:
(parted) set 2 lba on
The above command sets lba flag to on for second partition. Verify the results with print:
Change Partition Flag

Conclusion

Parted is a useful and powerful utility that can help you manage your disk partitions in Linux systems. As always, when working with disk partitions you need to be extra careful. It is strongly recommend to go through parted man pages to learn how you can customize it’s output and find more information about its capabilities.
If you have any questions or comments, please do not hesitate to use the comment section below.

Wednesday 8 April 2020

How to analyse MySQL slow_query_log like a pro?


How to Properly log slow queries:


Tested on Mariadb 10.3 on Debian 10:

Check if slow query log is running:

MariaDB [(none)]> show global variables like  "%slow%";
+------------------------------+--------------------------------------+
| Variable_name                | Value                                                                                                                                |
+------------------------------+--------------------------------------+
| log_slow_admin_statements    | ON                                                                                                                                   |
| log_slow_disabled_statements | sp                                                                                                                                   |
| log_slow_filter              |
| log_slow_rate_limit          | 1                                                                                                                                    |
| log_slow_slave_statements    | ON                                                                                                                                   |
| log_slow_verbosity           |                                                                                                                                      |
| slow_launch_time             | 2                                                                                                                                    |
| slow_query_log               | OFF                                                                                                                                  |
| slow_query_log_file          | up-slow.log                                                                                                                          |
+------------------------------+---------------------------------


Rotate the log to avoid old data to polute your current analysis:

mv /var/lib/mysql/slow-query.log /var/lib/mysql/slow-query.log.rm1

flush logs:

MariaDB [(none)]> flush logs;
Query OK, 0 rows affected (0.000 sec)

set the log to query ALL queries:

MariaDB [(none)]> set global slow_query_log=1;

Check the long_query_time (this is the threshhold number ins seconds to save a query in slow_query_log)

 MariaDB [(none)]> select @@global.long_query_time;
+--------------------------+
| @@global.long_query_time |
+--------------------------+
|                10.000000 |
+--------------------------+
 1 row in set (0.000 sec)

Set long_query_time to zero to catch all queries. Notice that this affects performance, especially at high qps rates.

MariaDB [(none)]> set global long_query_time=0;
Query OK, 0 rows affected (0.000 sec)

Now watch slow query log size:

 ls  -lh /var/lib/mysql/up-slow.log


When the log file reached a couple fo GB, stop it:

MariaDB [(none)]> set slow_query_log=0;


Download perona query digest:

wget percona.com/get/pt-query-digest

chmod 755 pt-query-digest

Save the slow query log into a separate file:

cp  /var/lib/mysql/up-slow.log /var/lib/mysql/up-slow.log.out

And analyze the file with percona query digest:

perl  pt-query-digest /var/lib/mysql/up-slow.log


How to Properly analyze the log:

The first list gives an overview of the database activity:

# Overall: 8.31M total, 419 unique, 2.52k QPS, 9.38x concurrency _________
# Time range: 2020-04-08 09:06:28 to 10:01:24
# Attribute          total     min     max     avg     95%  stddev  median
# ============     ======= ======= ======= ======= ======= ======= =======
# Exec time         30923s       0      3s     4ms    16ms    21ms   167us
# Lock time           461s       0   385ms    55us    89us   142us    54us
# Rows sent         21.60M       0  58.01k    2.72    0.99  261.70    0.99
# Rows examine      26.66G       0   1.52M   3.36k  313.99  27.22k    0.99
# Rows affecte      38.95k       0      40    0.00       0    0.08       0
# Bytes sent        12.90G       0  23.10M   1.63k   2.27k  99.98k  874.75
# Query size         3.20G       6 464.07k  412.69  833.10 1012.18  313.99

The more interesting though is Profile of individual queries:

# Profile
# Rank Query ID                    Response time   Calls   R/Call V/M   It
# ==== =========================== =============== ======= ====== ===== ==
#    1 0xC549CF6B5AA5A6C68867CA... 6078.5728 19.7%   50213 0.1211  0.01 SELECT post_commentlike

Profile lists the queries which, altogether consumed have  %95 of the processing time.

Rank: Queries sorted by overal time taken to execute.
Response time : total time spent on this query (in milisecons and % of total time)
Calls: How many times the query is called
R/Call: Response tiem per call. Avergage response time per call.
V/M: Variance to mean ration. AKA index of dispersion.  0 no variance, 1 most variant.
Item: Abreviate version of a query.


Check queries and Index the tables when needed:

CREATE INDEX col ON tbl(col);

Source: This great video:

More info:

Thursday 26 March 2020

Using ‘dd’ to benchmark disk performance

 To get started you should change to a directory to which you have read and write permissions. Or create and enter a new directory:
mkdir /home/bench/
cd /home/bench/
Make sure you have a few gigabytes of free disk space. Then use the following command to test the write speed of your storage:
dd if=/dev/zero of=diskbench bs=1M count=1024 conv=fdatasync
The results looks something like this from Stacklinux’s 3GB VPS:
1024+0 records in
1024+0 records out
1073741824 bytes (1.1 GB) copied, 0.553284 s, 1.9 GB/s
You’ll want this to be above 400 MB/s.

Using ‘dd’ to benchmark storage read performance

Now, lets delete the server’s buffer cache in order to measure ‘read’ speeds direct from the hard drive:
echo 3 | sudo tee /proc/sys/vm/drop_caches
Now that cache is deleted, we can test disk read performance of that ‘diskbench’ file using:
dd if=diskbench of=/dev/null bs=1M count=1024
This outputs the following:
1024+0 records in
1024+0 records out
1073741824 bytes (1.1 GB) copied, 0.425812 s, 2.5 GB/s

Using ‘dd’ to benchmark memory-buffered read performance

After running the above command, the data will be pushed to memory-buffered cache. So lets test read speeds using memory buffer by repeating the previous command:
dd if=diskbench of=/dev/null bs=1M count=1024
Which outputs the following:
1024+0 records in
1024+0 records out
1073741824 bytes (1.1 GB) copied, 0.135034 s, 8.0 GB/s
You should run this test a couple of times to a find the average. Lastly, remember to delete the 1.1GB test file using this command:
rm diskbench
If your results point to poor read/write performance you may want to look into upgrading hardware or switching your web hosts. In addition, more extensive tests can be performed using fiobonnie++ or IOzone.

Using ‘dd’ to benchmark CPU performance

If you would like to verify CPU speed and # of cores. Use the following commands:
lscpu
‘lscpu’ gathers CPU architecture information from sysfs and /proc/cpuinfo. The information includes the number of CPUs, threads, cores etc. There is also information about the CPU caches and cache sharing, family, model, bogoMIPS, byte order, and stepping.
nproc
‘nproc’ prints the number of processing units (cpu cores) available.
Now ‘dd’ can also be used for a simple CPU benchmark using:
dd if=/dev/zero bs=1M count=1024 | md5sum
The results:
1024+0 records in
1024+0 records out
1073741824 bytes (1.1 GB) copied, 2.5454 s, 422 MB/s
cd573cfaace07e7949bc0c46028904ff -
For most modern CPUs, you’ll want to see a minimum of 300 MB/s. Lower than that should prompt you to perform more accurate tests using BYTEmark or even unixbench. To sum things up, no matter your experience level, ‘dd’ can be used as a quick check into the disk, memory and CPU performance of your web server.

Using speedtest-cli for testing internet bandwidth

speedtest cli
speedtest-cli is a command line interface for testing internet bandwidth using speedtest.net. Issue the following commands to download and run the network speed test script:
wget -O speedtest-cli https://raw.githubusercontent.com/sivel/speedtest-cli/master/speedtest.py
chmod +x speedtest-cli
or
curl -Lo speedtest-cli https://raw.githubusercontent.com/sivel/speedtest-cli/master/speedtest.py
chmod +x speedtest-cli
./speedtest-cli
or for usage/help use:
./speedtest-cli -h

For reference, here’s a cut-an-paste of results as tested on an 8GB DigitalOcean droplet:
[root@droplet ~]# dd if=/dev/zero of=diskbench bs=1M count=1024 conv=fdatasync
1024+0 records in
1024+0 records out
1073741824 bytes (1.1 GB) copied, 2.51205 s, 427 MB/s
[root@droplet ~]# dd if=/dev/zero of=diskbench bs=1M count=1024 conv=fdatasync
1024+0 records in
1024+0 records out
1073741824 bytes (1.1 GB) copied, 2.84208 s, 378 MB/s
[root@droplet ~]# dd if=/dev/zero of=diskbench bs=1M count=1024 conv=fdatasync
1024+0 records in
1024+0 records out
1073741824 bytes (1.1 GB) copied, 2.09716 s, 512 MB/s
[root@droplet ~]# echo 3 | sudo tee /proc/sys/vm/drop_caches
3
[root@droplet ~]# dd if=diskbench of=/dev/null bs=1M count=1024
1024+0 records in
1024+0 records out
1073741824 bytes (1.1 GB) copied, 1.55411 s, 691 MB/s
[root@droplet ~]# dd if=diskbench of=/dev/null bs=1M count=1024
1024+0 records in
1024+0 records out
1073741824 bytes (1.1 GB) copied, 0.348052 s, 3.1 GB/s
[root@droplet ~]# dd if=diskbench of=/dev/null bs=1M count=1024
1024+0 records in
1024+0 records out
1073741824 bytes (1.1 GB) copied, 0.202393 s, 5.3 GB/s
[root@droplet ~]# rm diskbench
rm: remove regular file `diskbench'? y
[root@droplet ~]# nproc
4
[root@droplet ~]# dd if=/dev/zero bs=1M count=1024 | md5sum
1024+0 records in
1024+0 records out
1073741824 bytes (1.1 GB) copied, 3.34115 s, 321 MB/s
cd573cfaace07e7949bc0c46028904ff -
[root@droplet ~]# dd if=/dev/zero bs=1M count=1024 | md5sum
1024+0 records in
1024+0 records out
1073741824 bytes (1.1 GB) copied, 3.17004 s, 339 MB/s
cd573cfaace07e7949bc0c46028904ff -
[root@droplet ~]# dd if=/dev/zero bs=1M count=1024 | md5sum
1024+0 records in
1024+0 records out
1073741824 bytes (1.1 GB) copied, 3.09961 s, 346 MB/s
cd573cfaace07e7949bc0c46028904ff -
[root@droplet ~]#
Source

Wednesday 8 January 2020

nginx config for node.js app

server {
        listen 80 default_server;
        listen [::]:80 default_server;
        root /var/www/html;
        server_name _;
    location / {
        root /data/frontend;
        try_files $uri $uri/ /index.html;
    }
        location /api {
        proxy_pass http://localhost:5000;
    }
    location /socket.io {
        proxy_set_header Upgrade $http_upgrade;
        proxy_set_header Connection "upgrade";
        proxy_http_version 1.1;
        proxy_set_header X-Forwarded-For $proxy_add_x_forwarded_for;
        proxy_set_header Host $host;
        proxy_pass http://localhost:5000;
    }
}